Bangladesh economy stages uneven recovery
Production and export indicators suggest that some sectors are in the midst of a strong recovery, but other data lags behind.
This is the fourth edition of our set of 18 charts about the Bangladesh economy, with three months of further data.
For more about the purpose and background of the charts and about the significance of each indicator, read the first article in March here. The previous instalments confirmed the anecdotal evidence that at least the urban and formal sectors of the economy ground to a halt in 2020.
The picture for 2021, however, is more mixed. The indicators considered in our series point to a recovery, albeit patchy and uneven across different sectors. This is not surprising, as the economy was buffetted by the delta outbreak in the summer. It is too soon to see any impact of the omicron outbreak in the data.
Finally, it should be noted that the indicators only represent the urban, formal economy, and not the rural, agricultural, and the informal sectors. While it’s hard to see the informal sector thriving when the formal economy is sluggish, the lack of any explicit indicator of the agriculture sector presents an important caveat to the analysis presented.
* In Bangladesh, financial years are from 1July to 31 June.
Previous editions: March 2021; June 2021; September 2021.
Chart 1: Electricity Generation Prior to COVID-19, electricity generation was growing by 9-11% a year. After stagnating for a year, it staged a recovery in the summer of 2021. This series was growing by nearly 14% in the year to September 2021, consistent with an economic recovery.

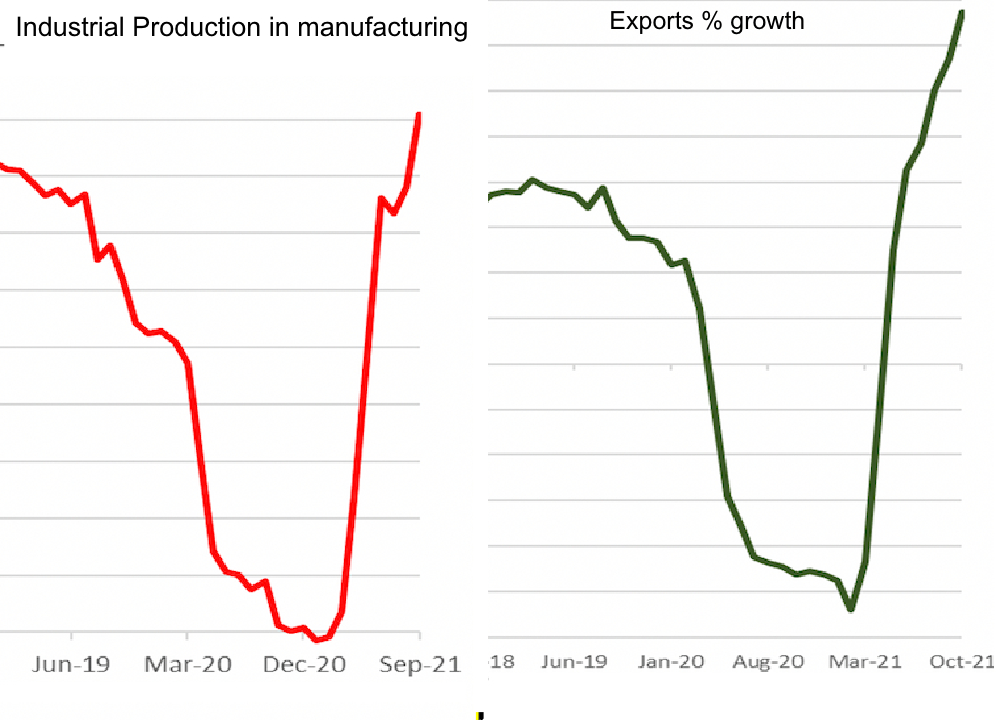
Chart 2: Industrial production After nearly a year of stagnation and growth of only around 5% in the year to April 2021, this series staged a recovery throughout the summer to grow by over 18% in the year to September 2021.

Chart 3: Exports Exports collapsed in 2020, but started a recovery in mid-2021, growing by 13% in the year to June. The recovery strengthened through the late summer, with growth in the series of over 23% in the year to October 2021.
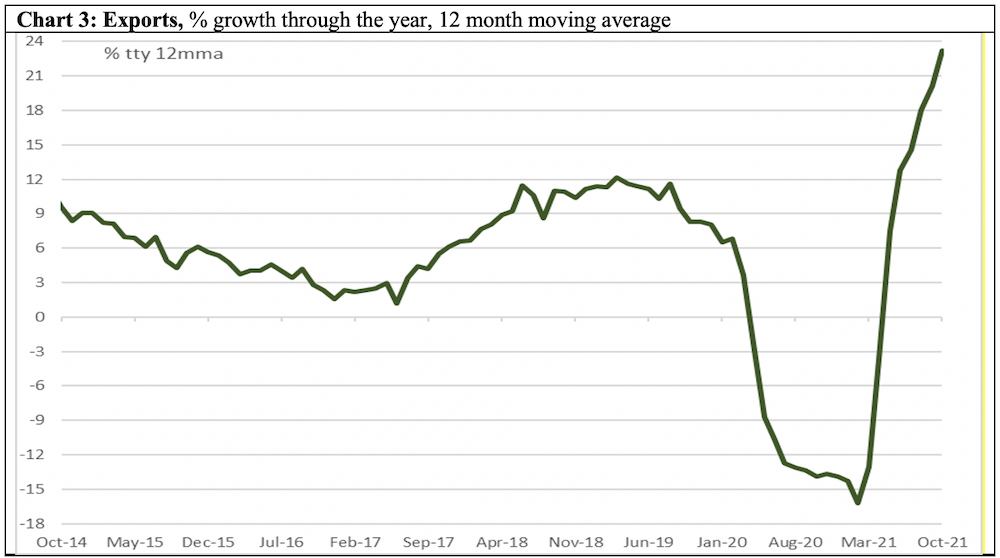
Chart 4: Imports Imports also collapsed in 2020, with a recovery in mid-2021 (growth of 12% in the year to June) that continued to gather pace in the late summer. Imports grew by over 36% in the year to October 2021, pointing to strong demand in the broader economy.
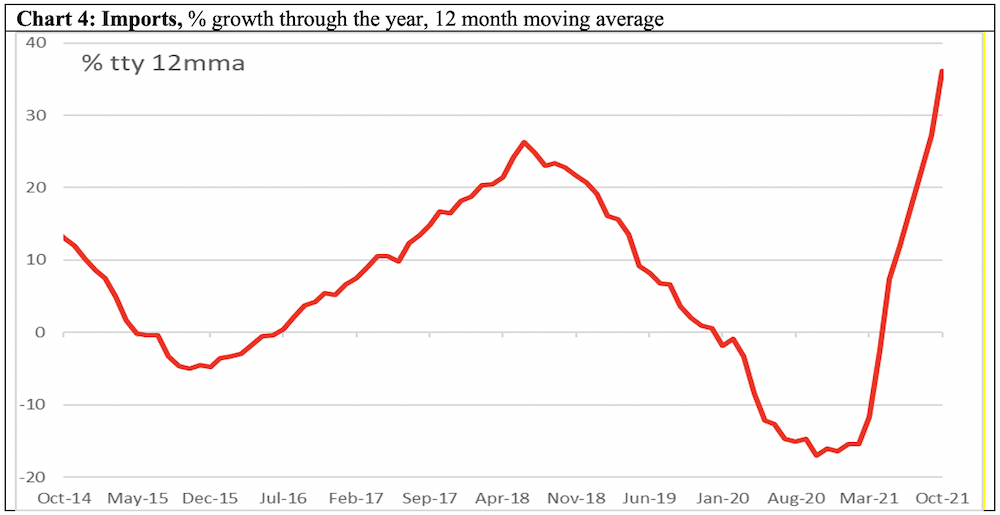
Chart 5: Credit to private sector Growth in credit to private sector started slowing in 2018, well before the pandemic. The slowdown in the series may have bottomed out in the summer (with growth of around 8% in the year to June), but the recovery remains tentative with growth of only around 9% in the year to November, a far cry from the 14-16% range in the mid 2020s.

Chart 6: Tax revenue After stagnating during much of 2020, tax revenue staged a recovery in the summer of 2021, growing by over 20% in the year to June. The recovery strengthened into the last quarter of 2021, with growth of over 24% in the year to October 2021.
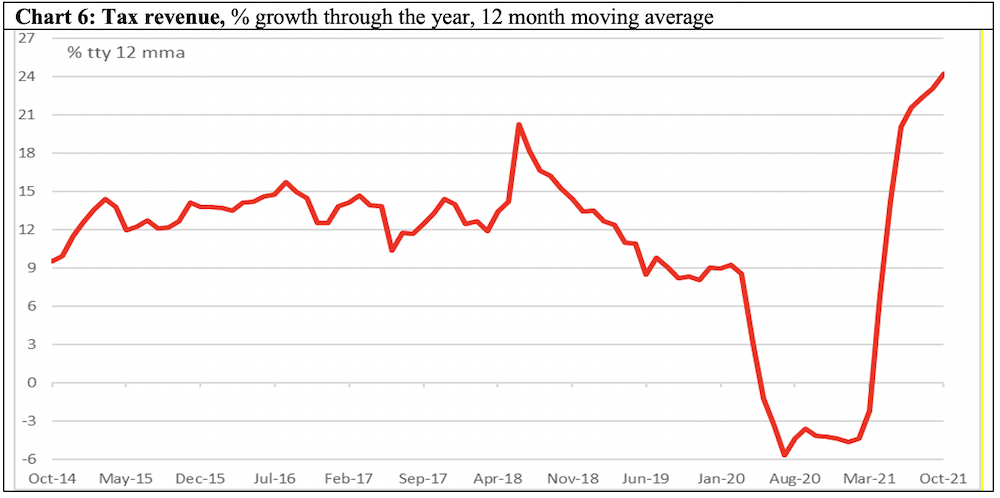
Chart 7 and 8: Development and non-development expenditure Both collapsed during the lockdown, and were showing signs of recovery in the year to June 2021. Unfortunately, subsequent data is yet to be made available.


Charts 9 and 10: Remittances and Overseas Workers The remittances had sharply increased in the year to April and May 2021, but the onset of the delta variant outbreak resulted in renewed decline in remittances that continued to December 2021, when the series recorded a fall of over 22% relative to a year earlier. The delta outbreak notwithstanding, the number of workers going overseas staged a strong recovery late in the year.


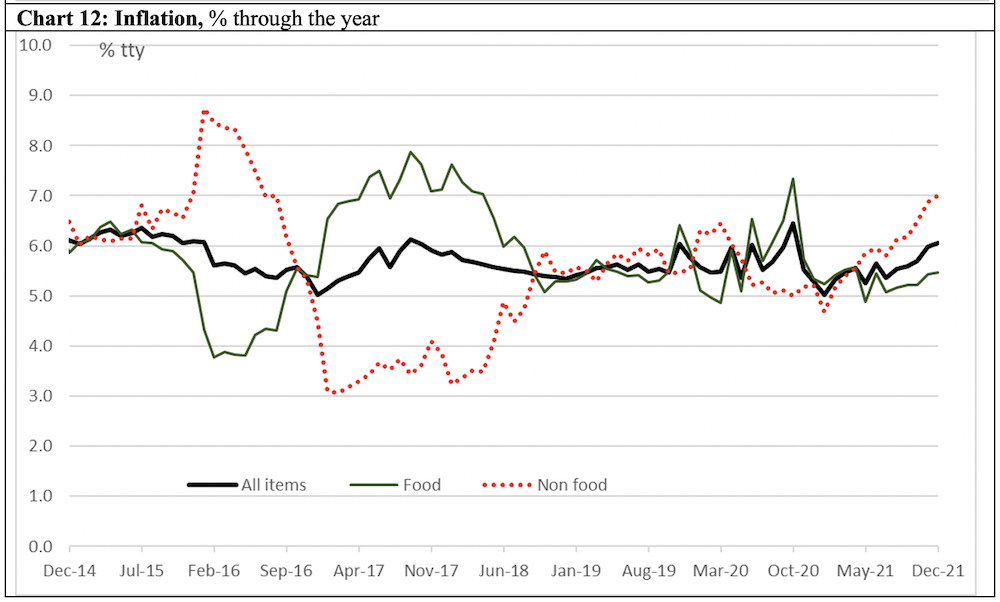
Charts 11 and 12: Wage rate index and inflation Wage rates had grown by 6.4% in the year to May 2021 but with the onset of the delta variant in mid‑2021, the growth in wage rates slowed sharply in the year to July. Wages appeared to recover later in the year. Inflation started rising in the second half of the year to be over 6% in the year to December 2021. The rise in inflation is driven by non-food prices, which recorded an inflation rate of 7% in the year to December 2021.

Charts 13 and 14: Price of rice and rental prices in Dhaka The price of rice continued to rise steadily upto August 2021 with a record high of 60 taka a kg, possibly reflecting the effect of the lockdowns on the supply chain and/or weakness in the agricultural sector. Rental price index in Dhaka meanwhile, showed no sign of recovery as of the summer of 2021.


Chart 15, 16, 17: Interest rates, credit to public sector and foreign reserves Since the beginning of the pandemic, Bangladesh Bank has cut official interest rates, and both deposit and borrowing rates continue to tumble as of November 2021. In theory, this should support economic activities. Public sector borrowing spiked at the onset of the pandemic. Notwithstanding an easing, credit to government was growing by 20% a year through most of 2021, a much faster pace compared with the pre‑pandemic years. Although declining, and notwithstanding controversies around classification, Bangladesh Bank’s stock of reserves (expressed in months of imports) continue to be far above what it considered an adequate level (usually said to be three months).

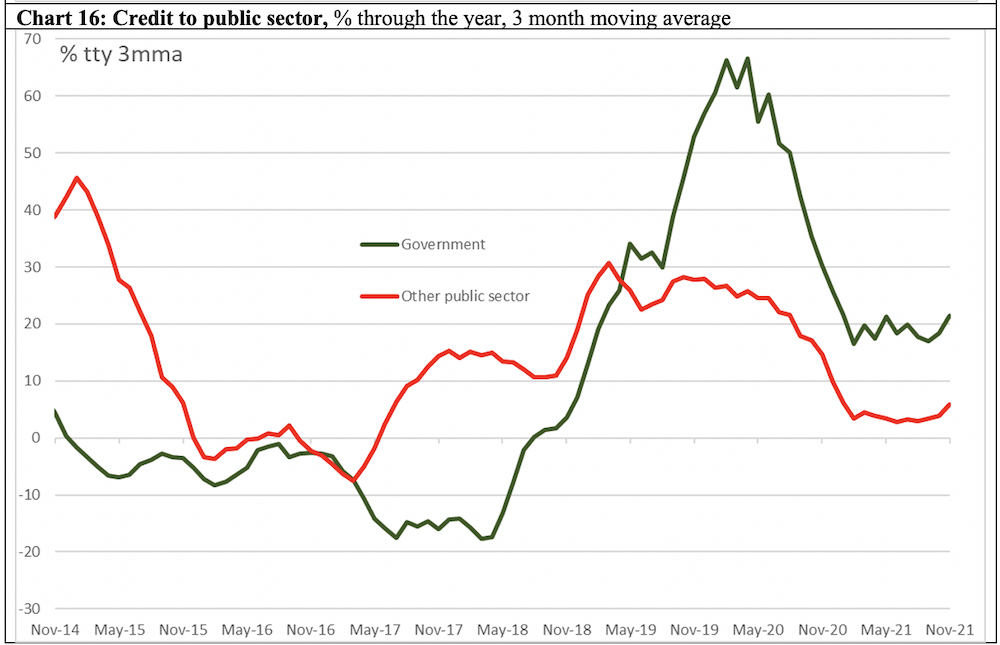
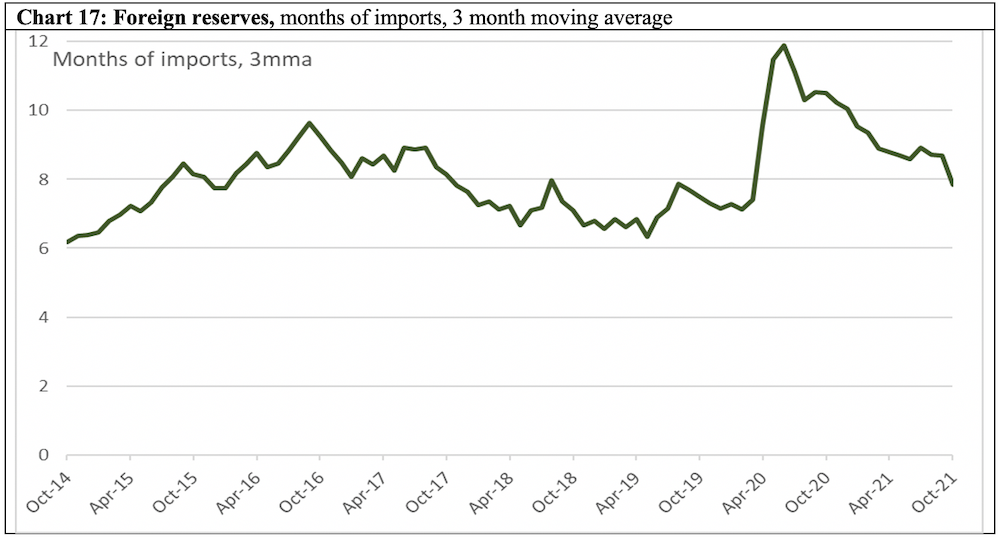
Chart 18: Stock Market Consistent with many of the indicators above, the Dhaka Stock Exchange (DSEX), which fell from mid-2019, and bottomed out in mid-2020, had finished the year on a strong note.

Overall Assessment
Bangladesh economy, already slowing before the COVID-19 recession, staged a recovery in the second half of 2021, albeit in an uneven manner. Production and external sector indicators recorded the strongest rebound. There were also signs of a durable recovery in household demands. In contrast, private investment and government expenditure were yet to show any evidence of strong recovery. Inflation started rising in the second half of 2021. Policies remain supportive of growth, but if it persists, inflation will test the policymakers. Stock market appears to be optimistic.●
Jyoti Rahman is an applied macroeconomist. His analysis is available at jrahman.substack.com, and he can be contacted at jyoti.rahman at gmail.com.
*All data are from the CEIC Asia Database. Raw data have been smoothed as indicated. The latest available data point in each series is shown in the charts.