Economy buffeted by inflationary pressure and exchange rate uncertainty
Tracking data show remittances remain weak and Bangladesh Bank’s foreign reserves dwindle
This is the sixth edition of our set of 18 charts about the Bangladesh economy, with three months of further data. For more about the purpose and background of the charts and about the significance of each indicator, read the first article from March 2021 here.
The most recent instalment posted in August 2022 showed that the post-pandemic recovery was at risk of being derailed by inflationary pressures. The latest data, set out below, confirms that the economy is being buffeted by inflation and exchange rate uncertainty. Worryingly, macroeconomic policy setting is not conducive to stem inflation and stabilize the economy. With inflation running higher than interest rates on loans, the real cost of borrowing is negative. This is fuelling private demand and imports. In the meantime, remittances remain weak, reflecting expectations of further rise in US dollar. The Bangladesh Bank’s foreign reserves are dwindling in an effort to prevent the exchange rate from depreciating and adding further to inflation. However, the lack of transparency surrounding the exchange and interest rate policies is adding to the uncertainty.
It should be noted that the indicators only represent the urban, formal economy, and not the rural, agricultural, and the informal sectors. It’s hard to see the informal sector avoiding the inflationary environment prevailing in the formal economy. However, the lack of any explicit indicator of the agriculture sector presents an important caveat to the analysis presented. (In Bangladesh, financial years are from 1July to 31 June.)*
Previous editions: March 2021; June 2021; September 2021; February 2022; August 2022.
Overall Assessment
Even as the economy continues to recover, it is being buffeted by inflation. Inappropriate policy settings are making things worse. Production and exports remain buoyant, despite problems in the electricity sector. Domestic demand has also recovered, as evidenced by growth in tax revenue, private sector credit, and imports. However, with negative real rate of borrowing, strong demand is further fuelling inflation and boosting imports growth, aggravating the effects of global inflation on Bangladesh. Meanwhile, uncertainties remain around the exchange rate, which is affecting remittance flows. Reserves are dwindling as the central bank tries to defend the exchange rate, but a lack of transparency is compounding problems.
Chart 1: Electricity Generation
Prior to the pandemic, electricity generation was growing by 9-11% a year. After stagnating for a year, it staged a recovery in the summer of 2021. This series showed 12-14% growth in the second half of 2021 and beginning of 2022, but started slowing sharply into the summer. Growth in the series was 4% in the year to July 2022. The slowdown reflects the widespread loadshedding reported in the media in recent months.
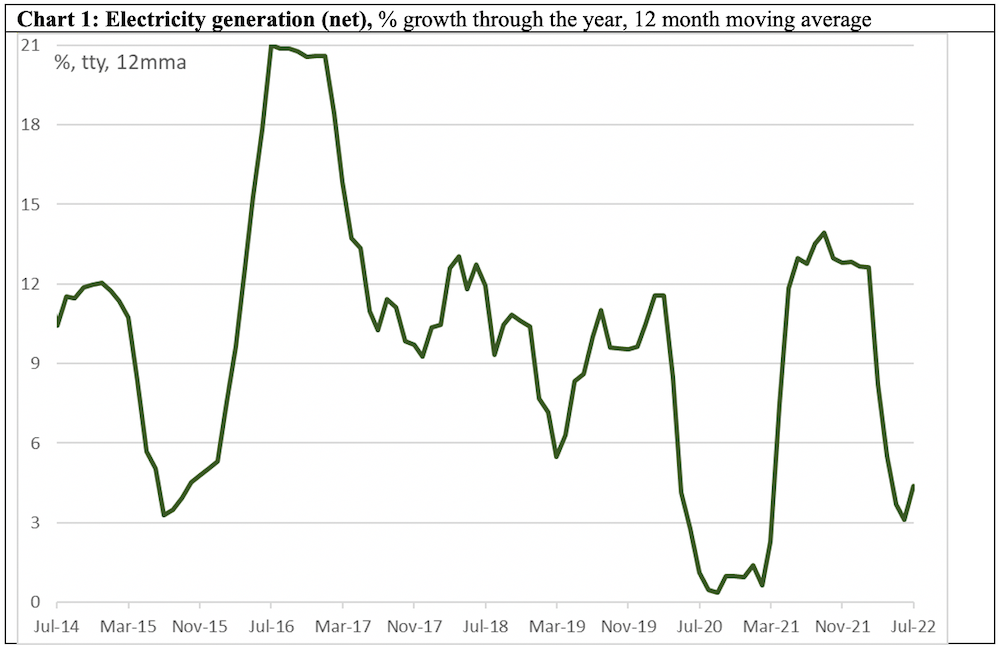
Chart 2: Industrial production
Prior to the pandemic, this series recorded yearly growth of 14-16%. Shaking off the pandemic induced stagnation, the series staged a rebound in the second half of 2021 and the first quarter of 2022. Growth in industrial production moderated to be 14% higher in the year to June 2022. It is too soon to judge whether this reflects a return to the pre-2020 trend or presages further slowdown.
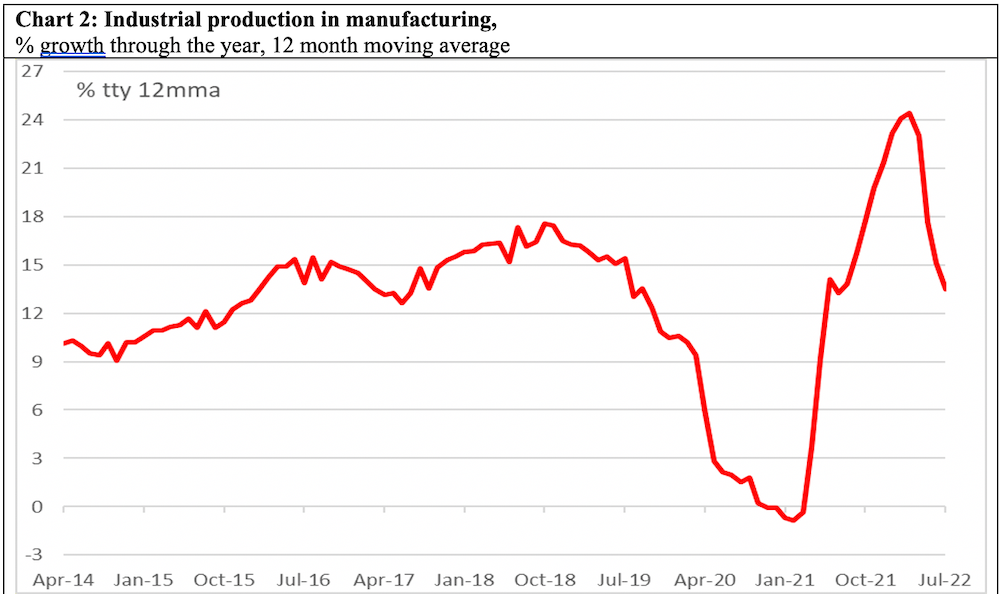
Chart 3: Exports
Exports also staged a strong post-pandemic recovery from mid-2021, which continued into 2022, with growth in the series of around 35% in the year to August 2022, compared to a pre-pandemic trend of around 12%.
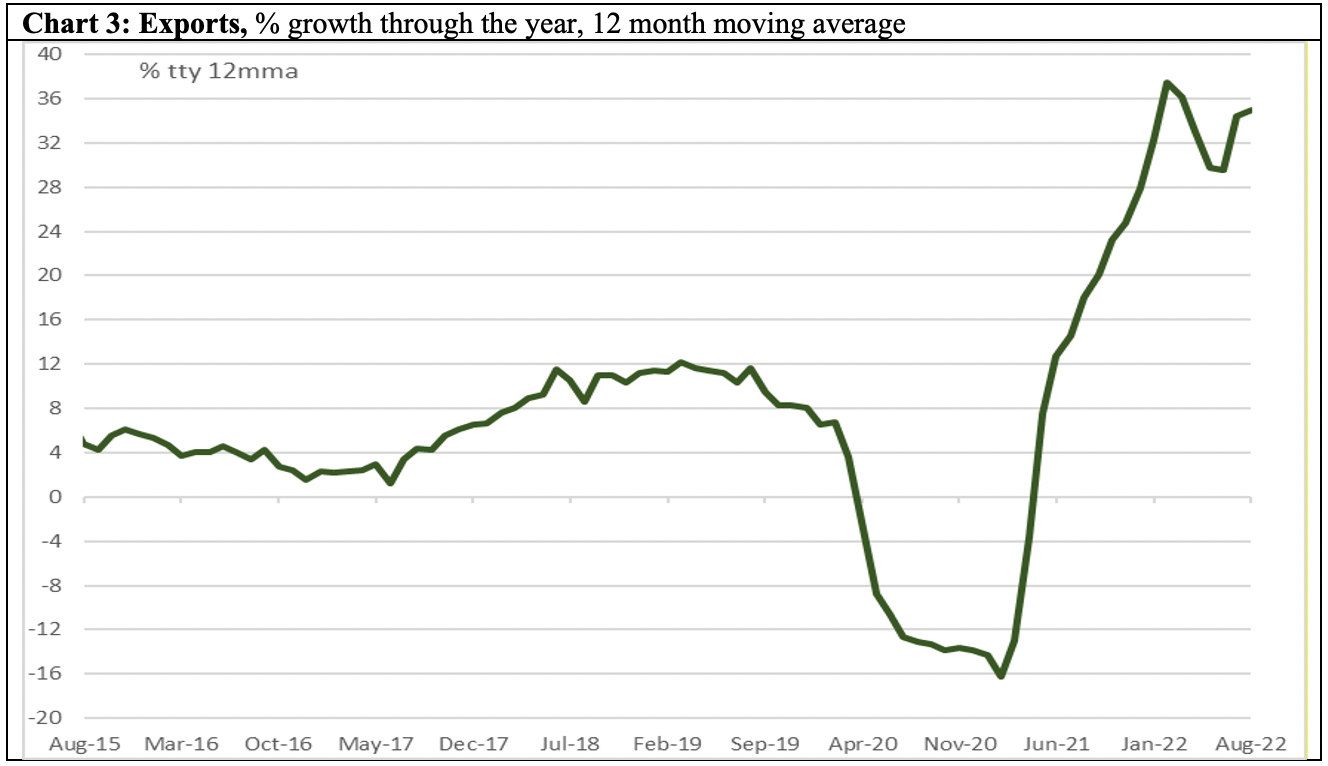
Chart 4: Imports
Imports also started recovering in mid-2021, consistent with signs of strength in other indicators. Imports growth surged further in the summer of 2022, to be 51% in the year to August. The recent pace of imports growth, however, likely reflect high global energy and intermediate goods prices as well as strong domestic demand.
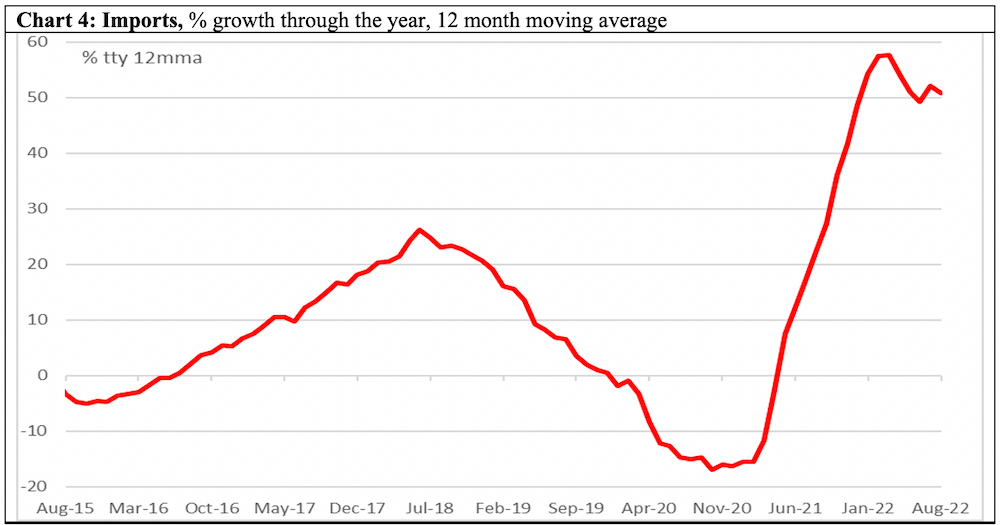
Chart 5: Credit to private sector
Growth in credit to private sector started slowing in 2018, well before the pandemic. The slowdown in the series bottomed out in mid-2021, and recovery has continued into mid‑2022. The series grew by 14% in the year to September, similar to the 14-16% range witnessed in the mid 2020s. To the extent that the pick up in this indicator reflects the negative real rate of borrowing (see Chart 15), this is a sign of economic imbalance and harbinger of future instability.
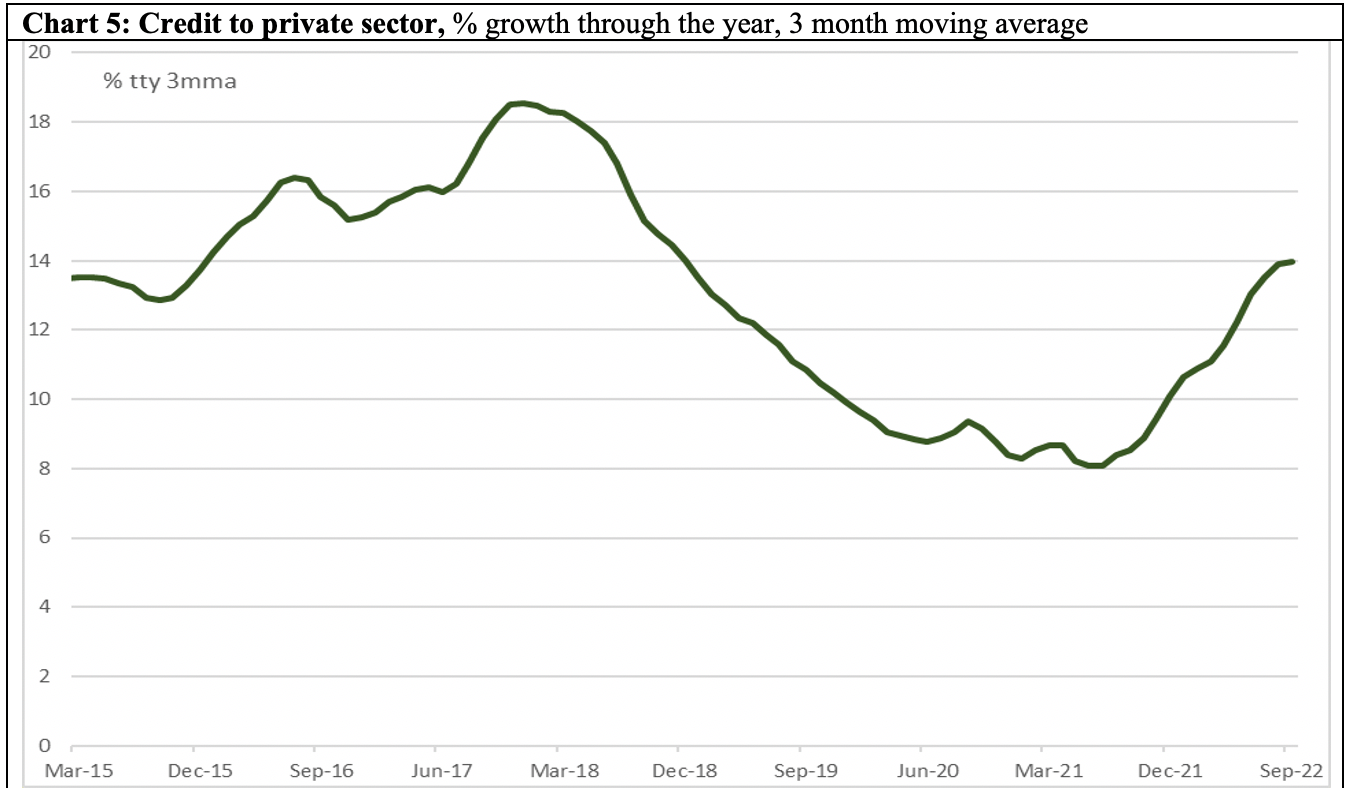
Chart 6: Tax revenue
Shaking off the pandemic slump, tax revenue grew strongly in 2021-22 financial year. While growth in the series has eased somewhat from the torrid pace of late 2021, tax revenues were up 16% in the year to September 2022, compared with the 12-15% range witnessed in the mid 2020s.
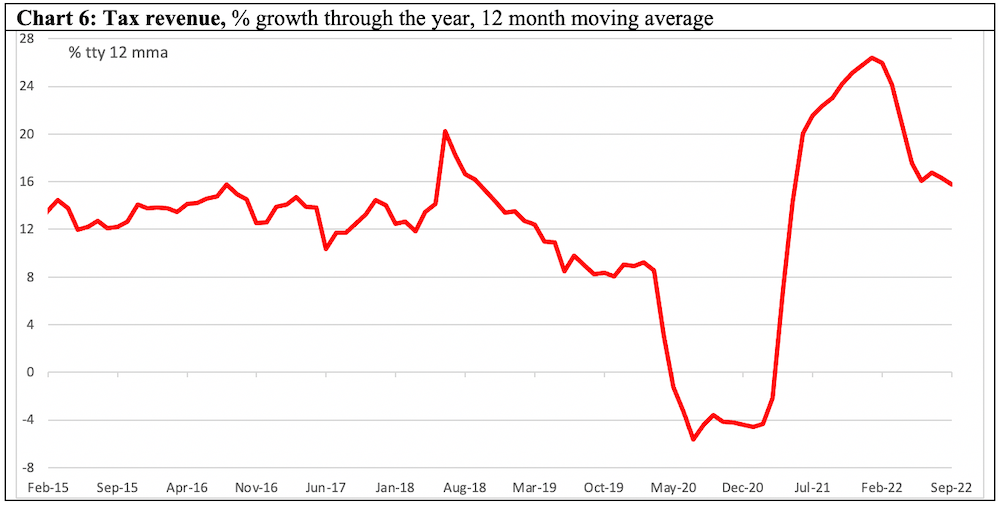
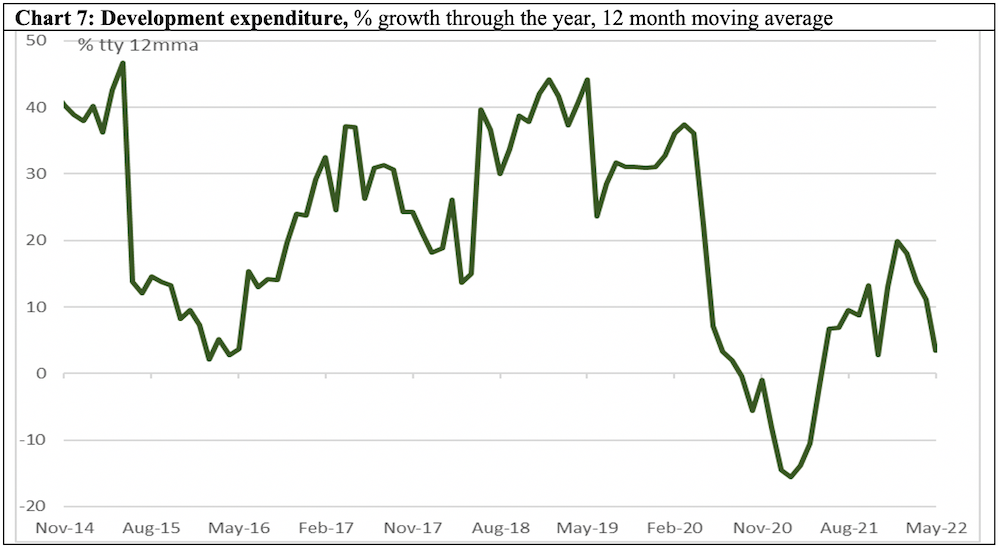
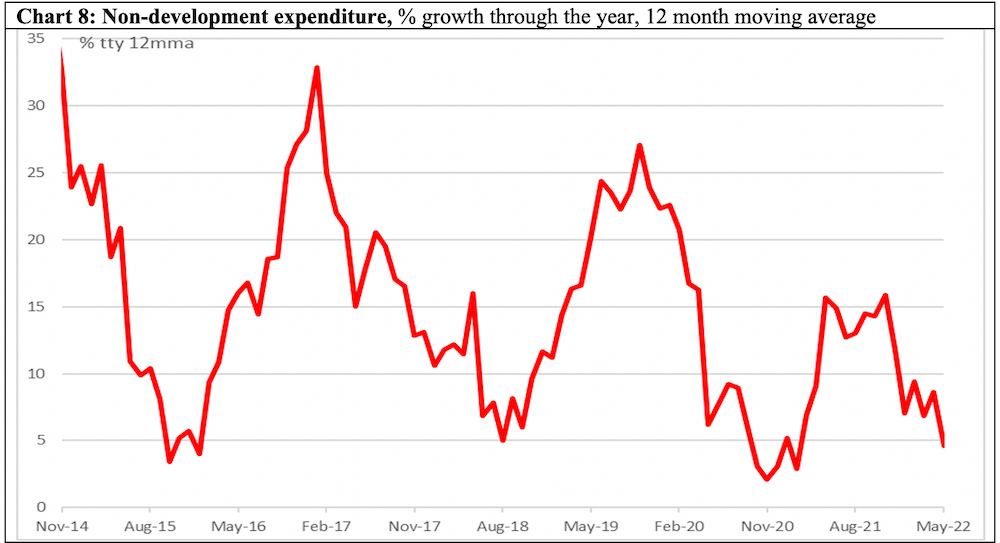
Chart 7 and 8: Development and non-development expenditure
Both recovered in 2021-22, but growth in both series in the year to May 2022 were still sluggish compared with the pre-pandemic norm. Data for the current fiscal year is yet to be made available.
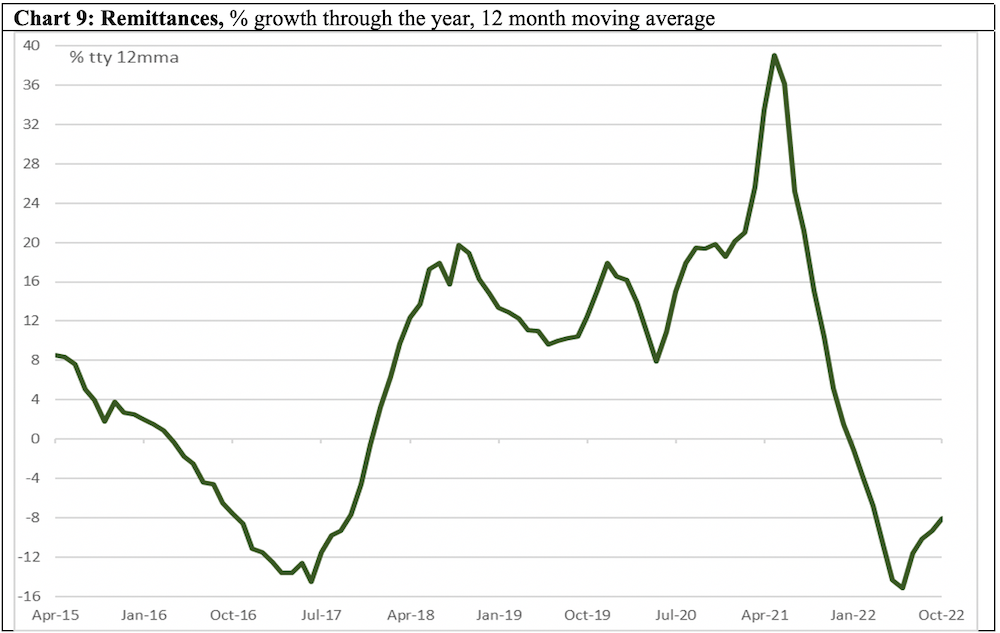
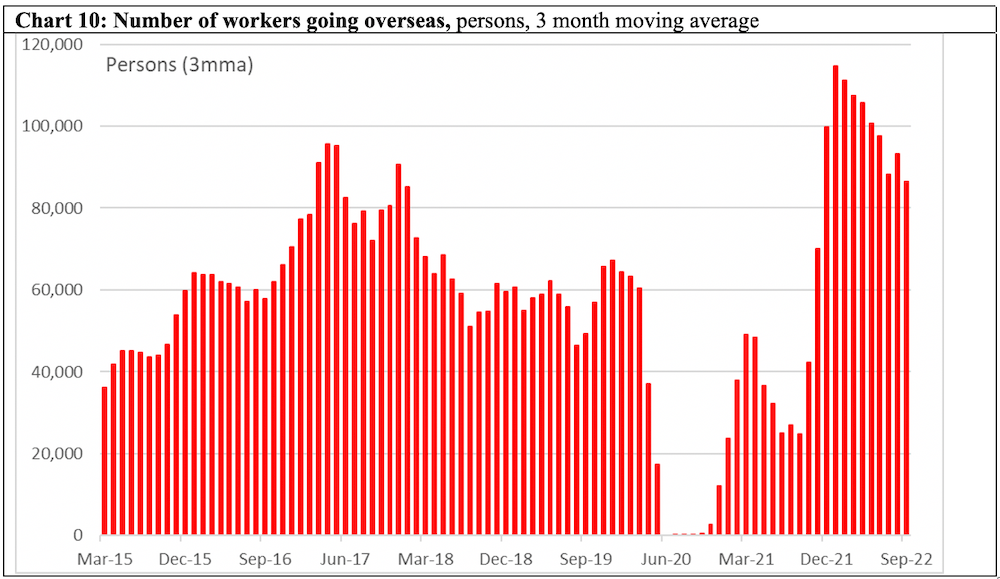
Charts 9 and 10: Remittances and Overseas Workers
The remittances have been exhibiting sharp volatility in recent years, likely reflecting the pandemic-induced disruptions in the informal hundi channel. Remittances slumped from record growth in mid-2021. In contrast, the number of workers going overseas staged a strong recovery, with record numbers leaving in the first half of 2022. Recent weakness in remittances despite the strength in the overseas workers series likely reflect the volatility in foreign exchange market, which discourages workers from using the formal channel to remit money. Specifically, given the strength of the US dollar and the concerns about foreign reserves, remitters may well be expecting further depreciation of taka in the coming months, and therefore holding off their current remittance.
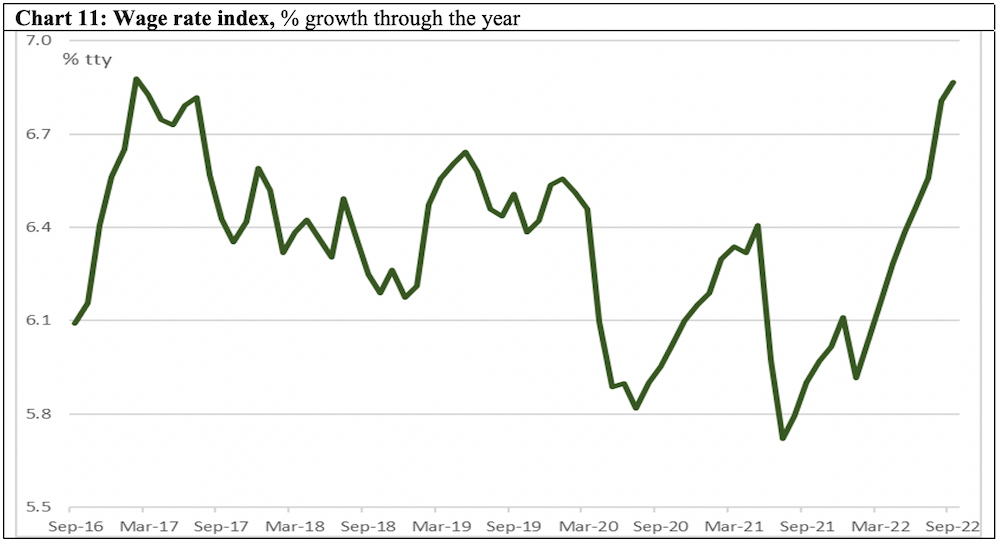
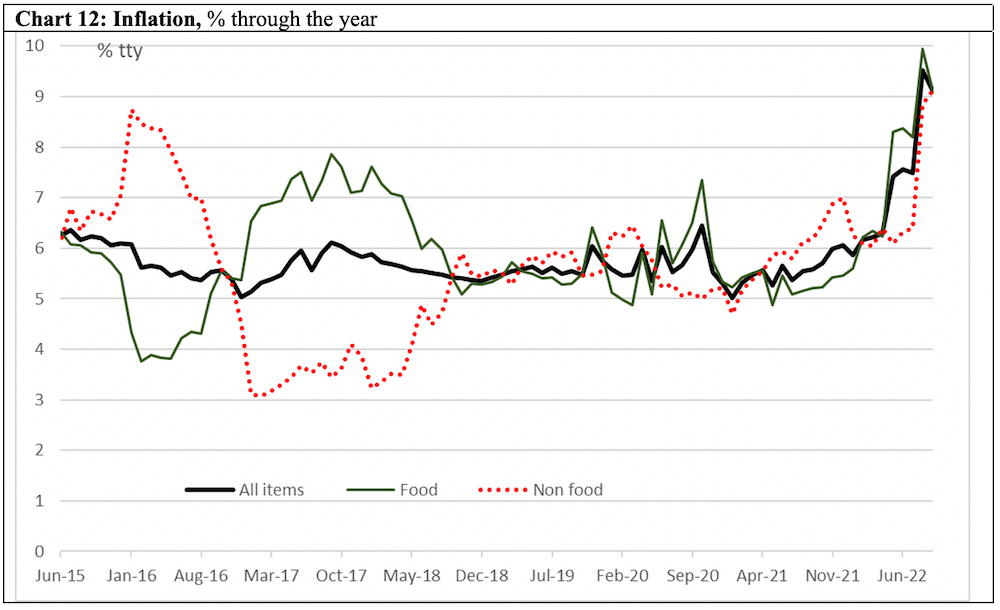
Charts 11 and 12: Wage rate index and inflation
Wage rates had grown by nearly 7% in the year to September 2022, consistent with the strength in various other indicators. However, inflation surged even faster, with consumer prices (both food and non-food) rising by 9.1% in the year to September.
Charts 13 and 14: Price of rice and rental prices in Dhaka
The cost of living pressure was evident in the price of rice hitting a record 63 taka a kg in August 2022. Rental price index in Dhaka started recovering in late 2021.
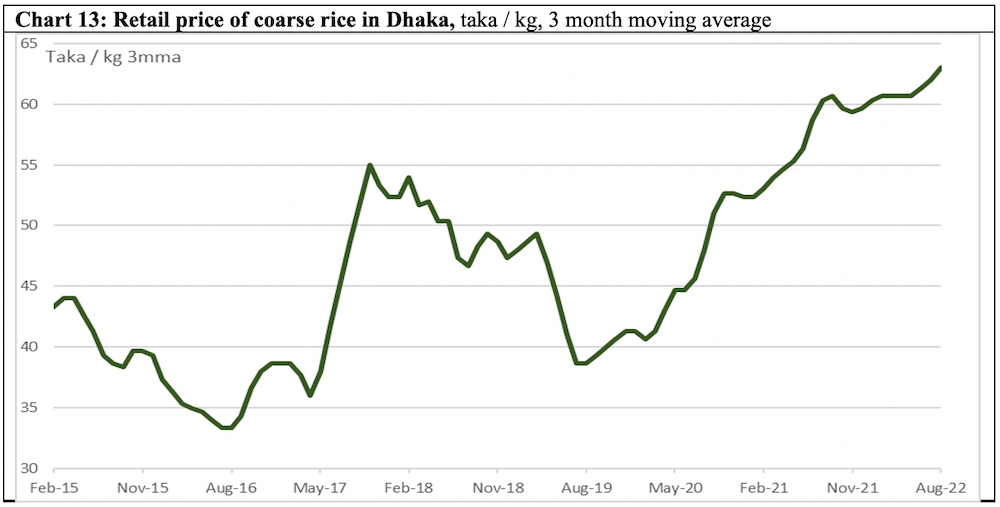
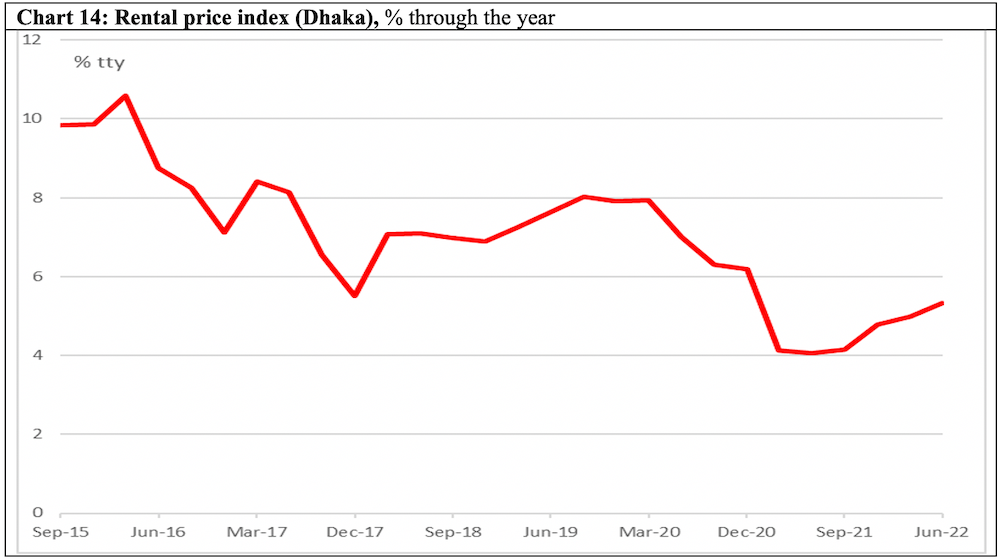
Chart 15, 16, 17: Interest rates, credit to public sector and foreign reserves
Bangladesh Bank cut official interest rates during the pandemic, and both deposit and borrowing rates tumbled. While the central bank has stated its commitment to stemming inflation, this is yet to be visible in the interest rates. In fact, with borrowing and lending rates capped, the real interest rate of borrowing is now negative. Public sector borrowing grew at a much faster pace in in 2020-21 compared with the pre‑pandemic years, and is still growing at a brisk pace. That is, the macroeconomic policy setting is likely to be adding to inflation than curbing it. Bangladesh Bank’s stock of reserves have been declining. When measured in line with international standards, reserves were sufficient to cover four months of imports as of August. This is higher than three months that is usually considered adequate to support the exchange rate. However, given the recent strength of the US dollar in global markets, fast pace of imports growth, weak remittances, and high inflation environment, taka may well face further depreciation pressures.
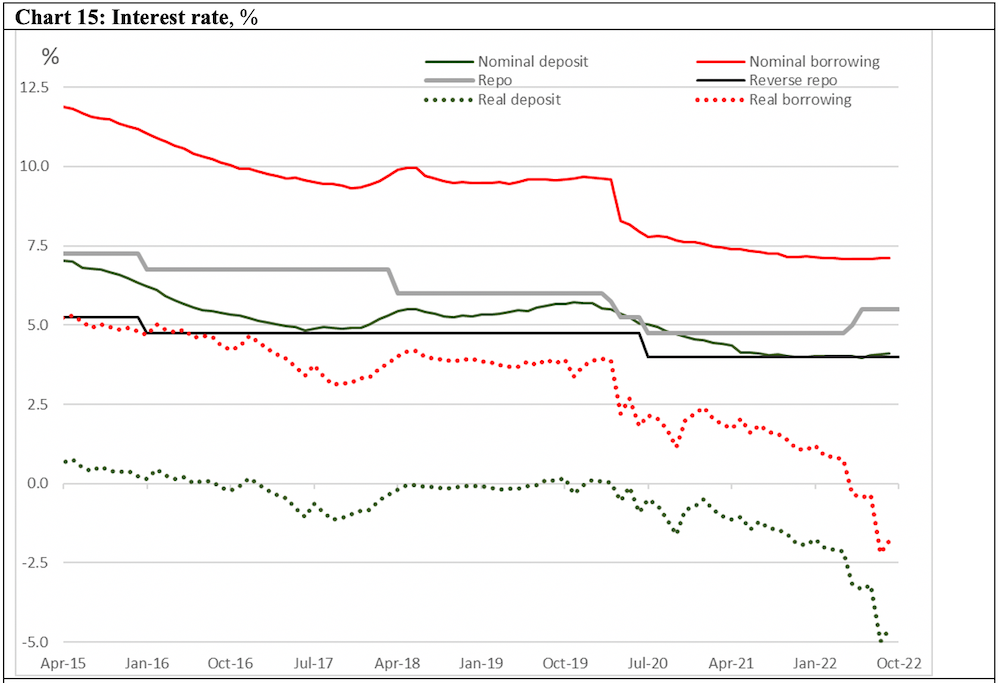
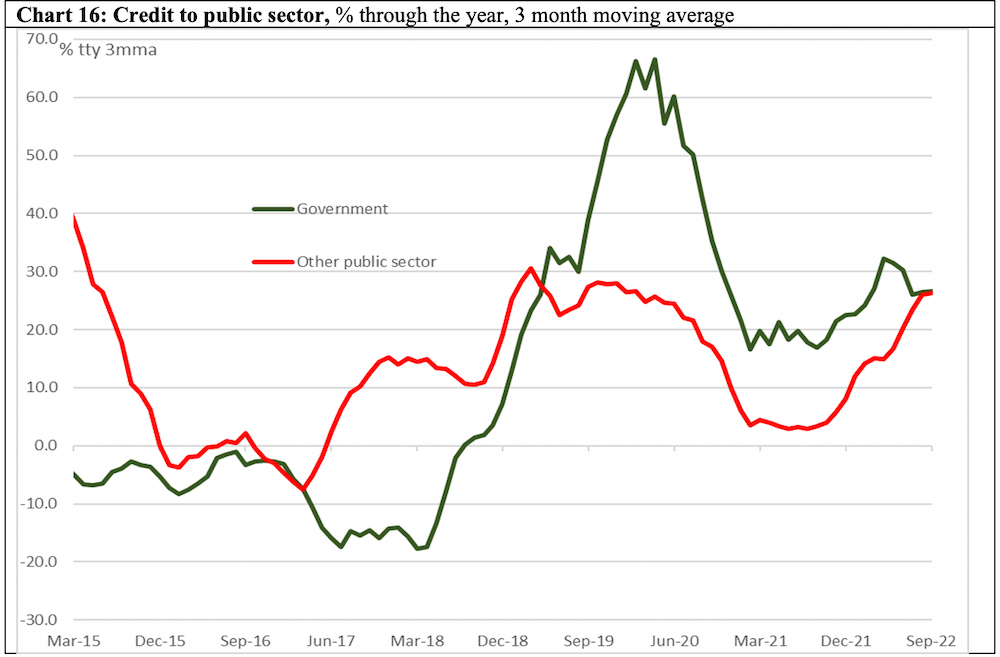
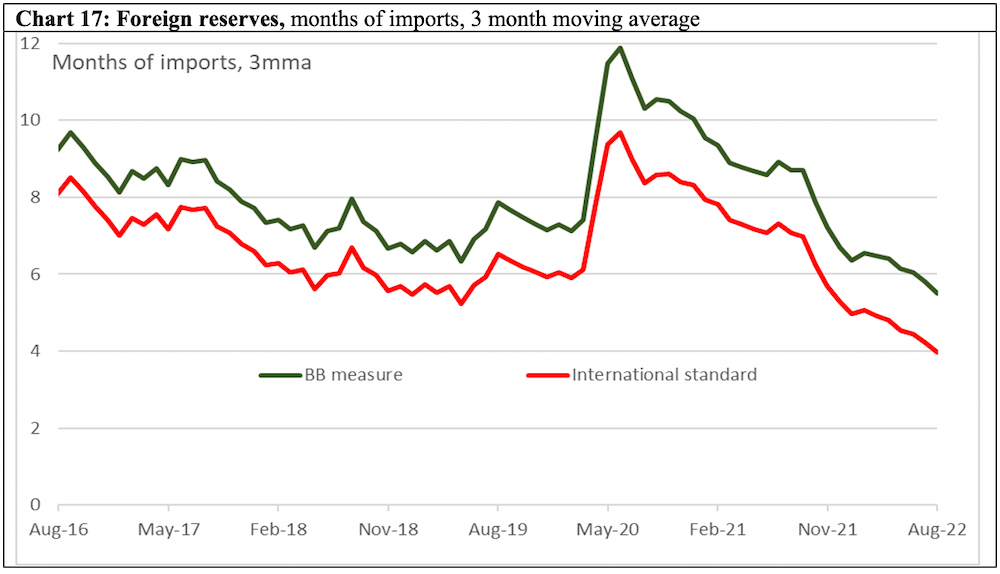
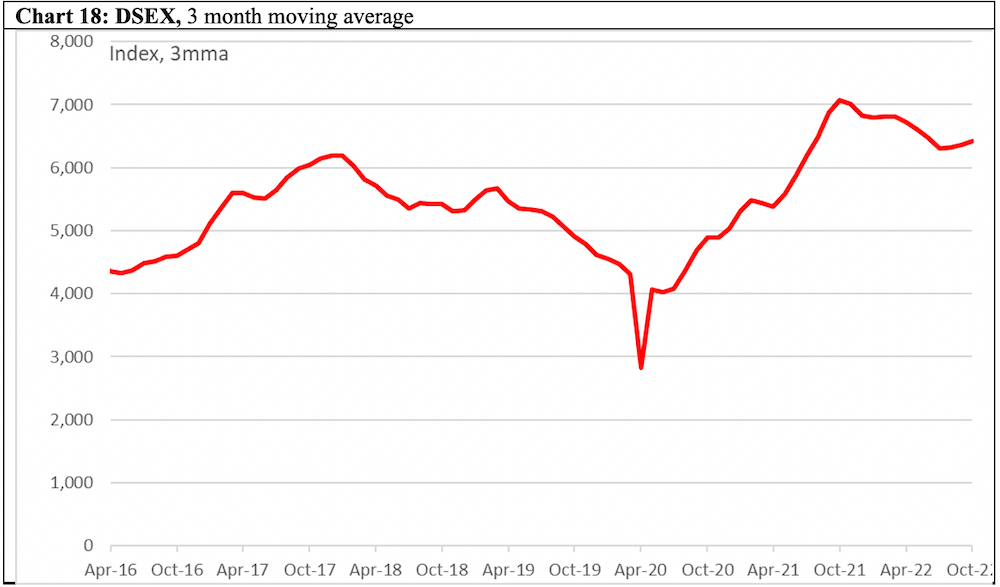
Chart 18: Stock Market
The Dhaka Stock Exchange (DSEX), has remained generally strong in 2022.
Jyoti Rahman is an applied macroeconomist. His analysis is available at www.jrahman.substack.com, and he canJyoti be contacted at [email protected].
*All data are from the CEIC Asia Database. Raw data have been smoothed as indicated. The latest available data point in each series is shown in the charts.