Growth at risk from inflationary pressures
Economic policy settings shift gear from supporting growth to combating inflation and stabilising the exchange rate.

This is the fifth edition of our set of 18 charts about the Bangladesh economy, with six months of further data.
For more about the purpose and background of the charts and about the significance of each indicator, read the first article from March 2021 here. The previous instalments confirmed that after grounding to a halt in 2020, the economy staged a patchy recovery in 2021. The recovery gathered strength in the first quarter of 2022, but the momentum is at risk of being derailed by inflationary pressures. Import grew sharply, likely reflecting the spike in global energy prices. The effects of recent volatility in the foreign exchange market are yet to be seen in the available data.
It should be noted that the indicators only represent the urban, formal economy, and not the rural, agricultural, and the informal sectors. While it’s hard to see the informal sector thriving when the formal economy is sluggish, the lack of any explicit indicator of the agriculture sector presents an important caveat to the analysis presented. (In Bangladesh, financial years are from 1st July to 31st June.)*
Previous editions: March 2021; June 2021; September 2021; February 2022.
Overall assessment
The economic recovery gathered momentum into 2022. Production and exports recorded the strongest rebound, and there were also signs of a durable recovery in household demands. However, inflation pressures became clearly evident by the summer, and the high global energy prices likely contributed to surging imports growth. Policy settings are in the process of shifting gear from supporting growth to combating inflation and stabilising the exchange rate. Stock market appears to be optimistic.
Chart 1: Electricity generation
Prior to Covid-19, electricity generation was growing by 9-11% a year. After stagnating for a year, it staged a recovery in the summer of 2021. This series showed 12-14% growth in the second half of 2021 and beginning of 2022, but started slowing sharply into the summer. Growth in the series was 8% in the year to March 2022. The slowdown presages the load-shedding reported in the media in recent months.

Chart 2: Industrial production
Prior to the pandemic, this series recorded yearly growth of 14-16%. Shaking off the pandemic induced stagnation, the series started recovering in the summer of 2021. The momentum continued in the first quarter of the year, with industrial production up by 22% in the year to March 2022.

Chart 3: Exports
Exports also staged the post-pandemic recovery from mid-2021, which continued into 2022, with growth in the series of nearly 30% in the year to May 2022. It is too early to tell whether the recent easing in growth reflects a return to the pre-pandemic trend or the beginning of a general slowdown.
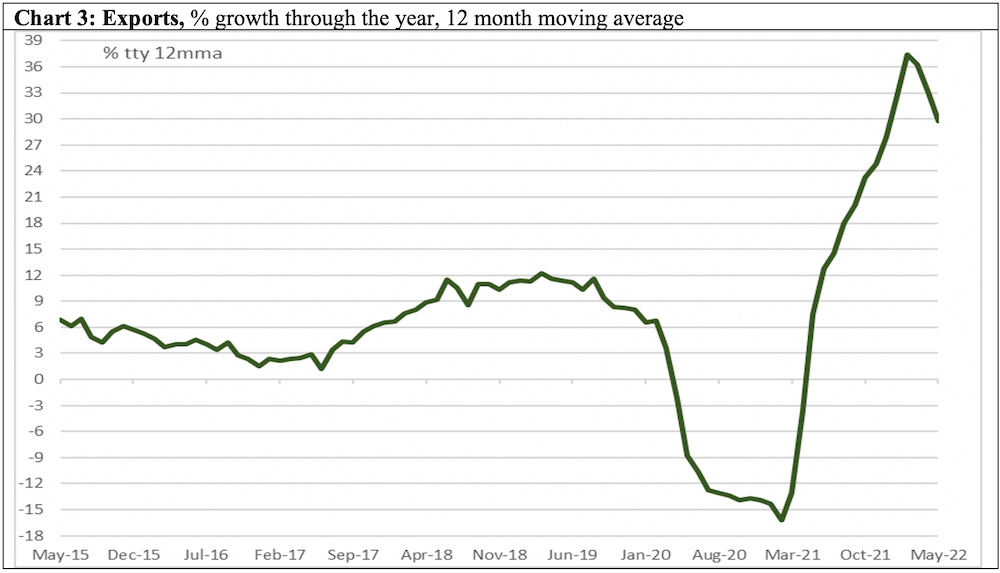
Chart 4: Imports
Imports also started recovering in mid-2021, consistent with signs of strength in other indicators. Imports growth surged further in the summer of 2022, to be 51% in the year to May. The recent pace of imports growth, however, likely reflects very high global energy prices rather than domestic economic factors.
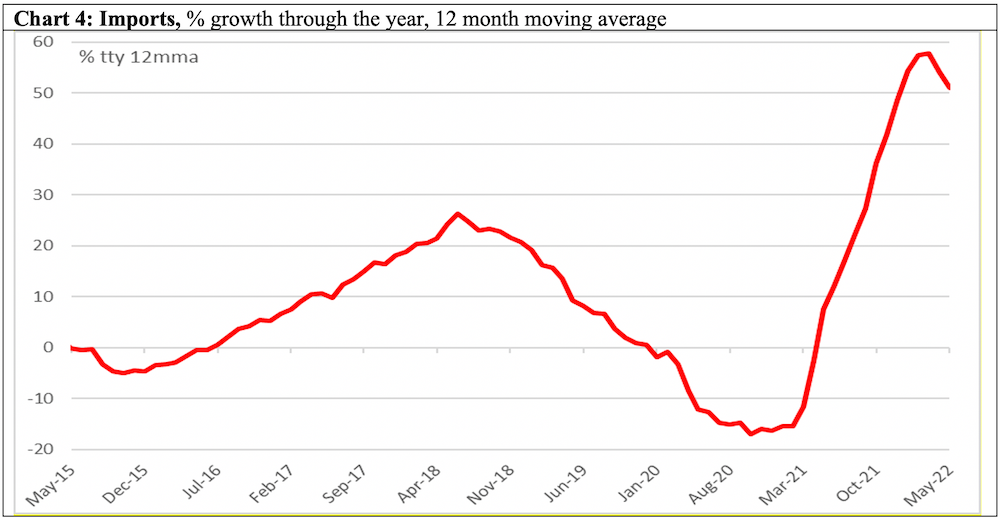
Chart 5: Credit to private sector
Growth in credit to private sector started slowing in 2018, well before the pandemic. The slowdown in the series bottomed out in mid-2021, and recovery has continued into mid‑2022. The series grew by 13% in the year to June, compared with the 14-16% range witnessed in the mid 2020s.
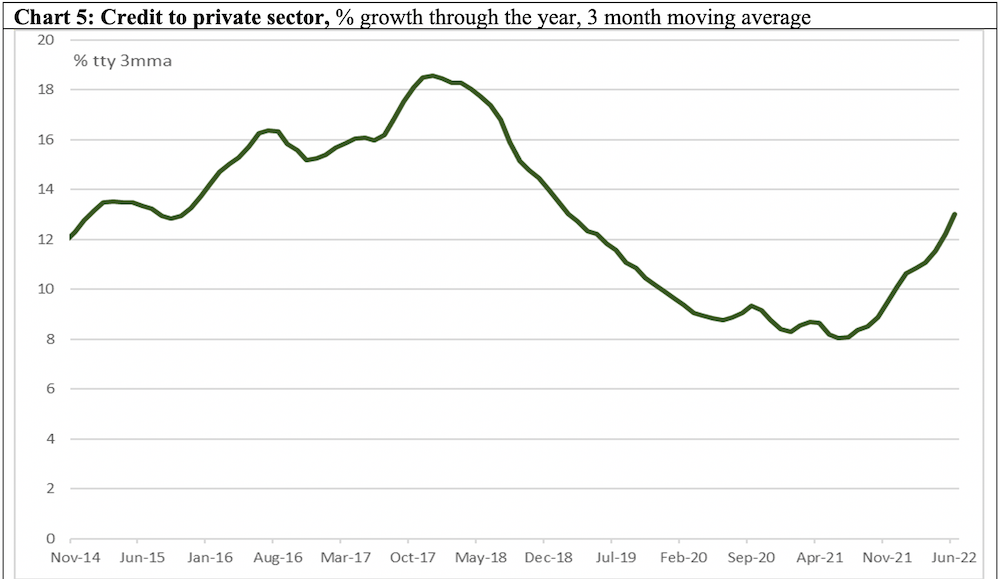
Chart 6: Tax revenue
Shaking off the pandemic slump, tax revenue grew strongly in the 2021-22 financial year. The series was up 18% in the year to May 2022, compared with the 12-15% range witnessed in the mid 2020s. It is as yet unclear whether the recent easing in growth reflects a return to the post-pandemic trend or a general weakening.

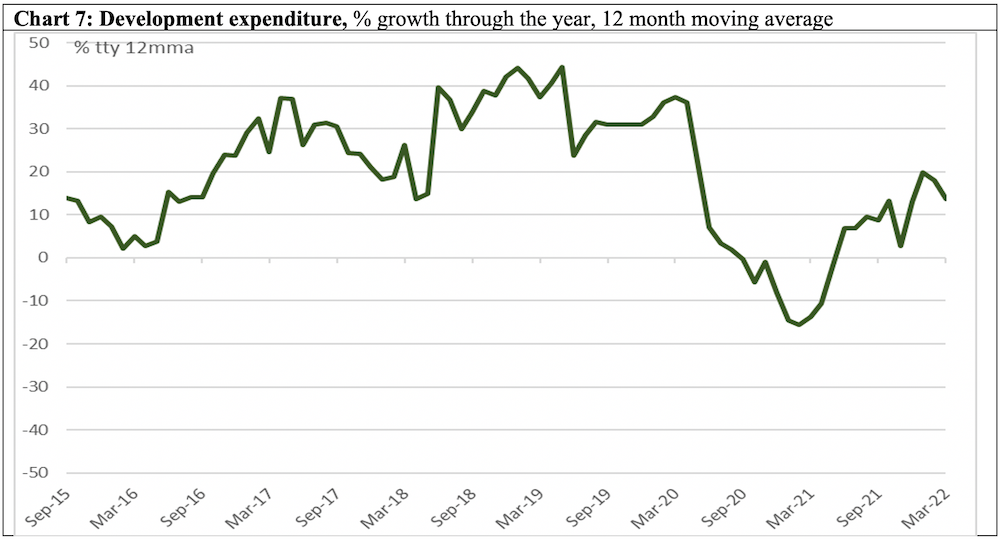
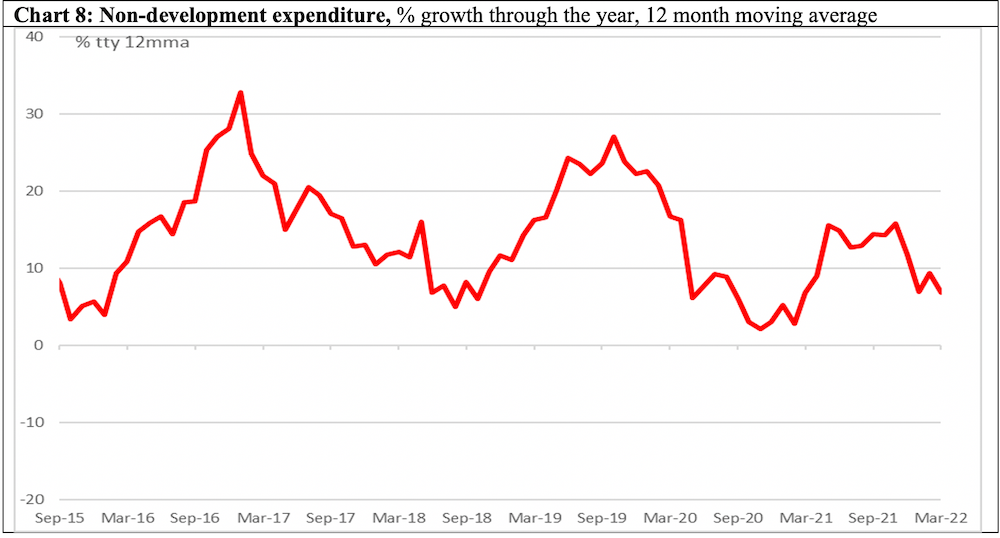
Chart 7 and 8: Development and non-development expenditure
Both of these indicators recovered in 2021-22, but growth in both series in the year to March 2022 were still slower compared with the pre-pandemic norm.
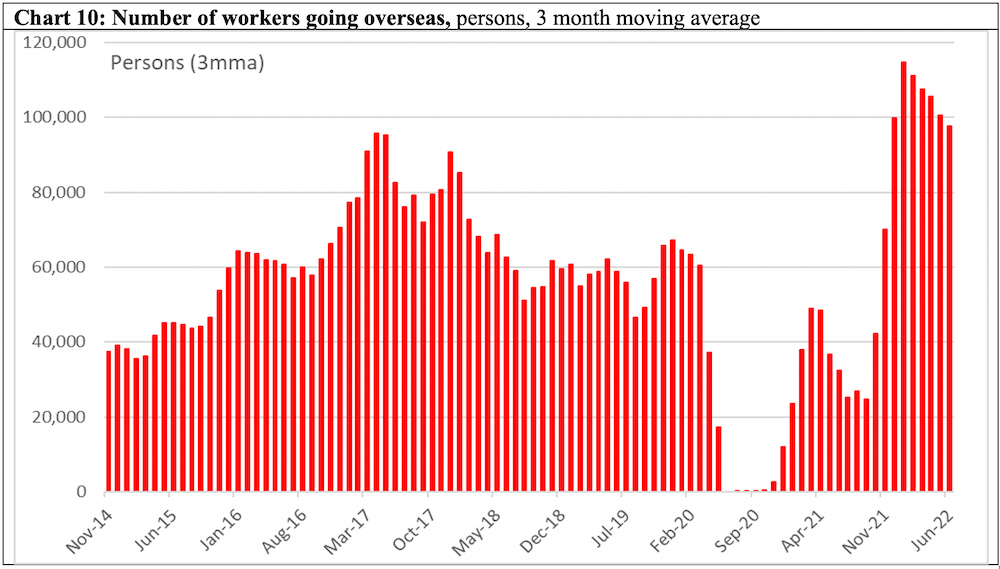
Charts 9 and 10: Remittances and overseas workers
The remittances have been exhibiting sharp volatility in recent years, likely reflecting the pandemic-induced disruptions in the informal hundi channel. Remittances have slumped sharply in the past year, from record growth in mid-2021. In contrast, the number of workers going overseas staged a strong recovery, with record numbers leaving in the first half of 2022.

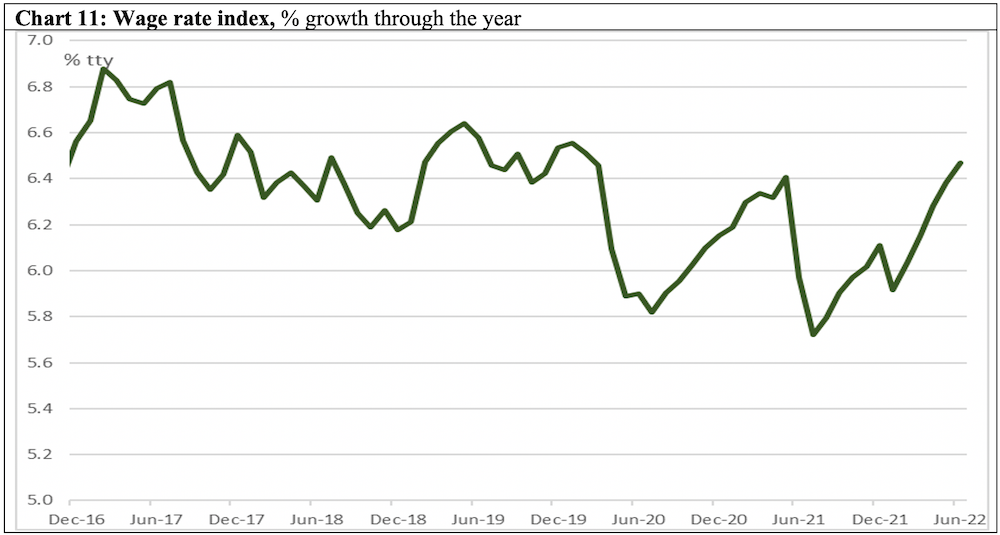
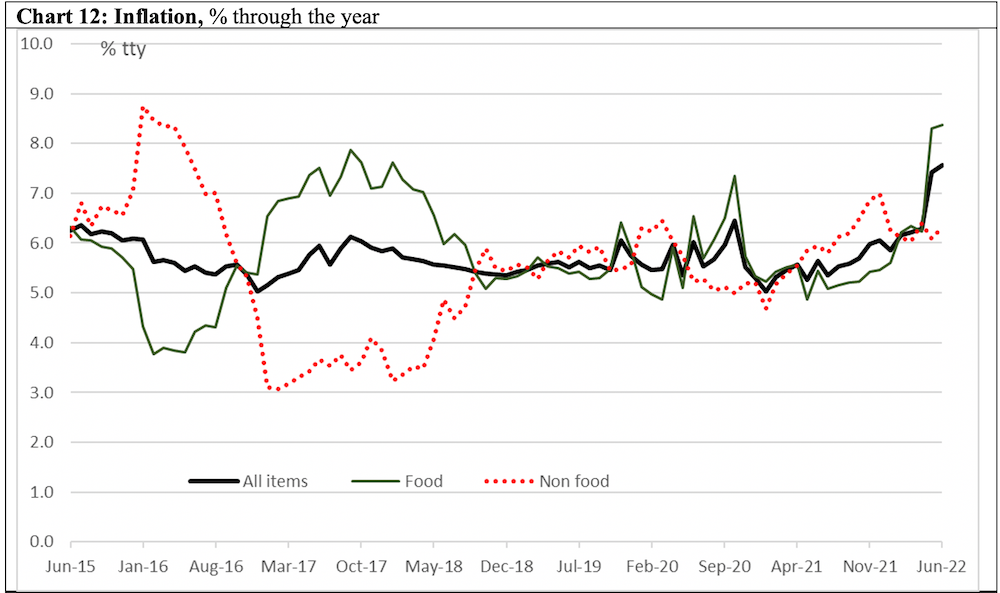
Charts 11 and 12: Wage rate index and inflation
Wage rates had grown by 6.5% in the year to June 2022, consistent with the strength in various other indicators. However, inflation surged even faster, with consumer prices rising by 7.6% in the year to June. Food prices were up by 8.4% over the same period.
Charts 13 and 14: Price of rice and rental prices in Dhaka
The cost of living pressure was evident in the price of rice topping 60 taka a kg in the first four months of 2022. Rental price index in Dhaka started recovering in late 2021.

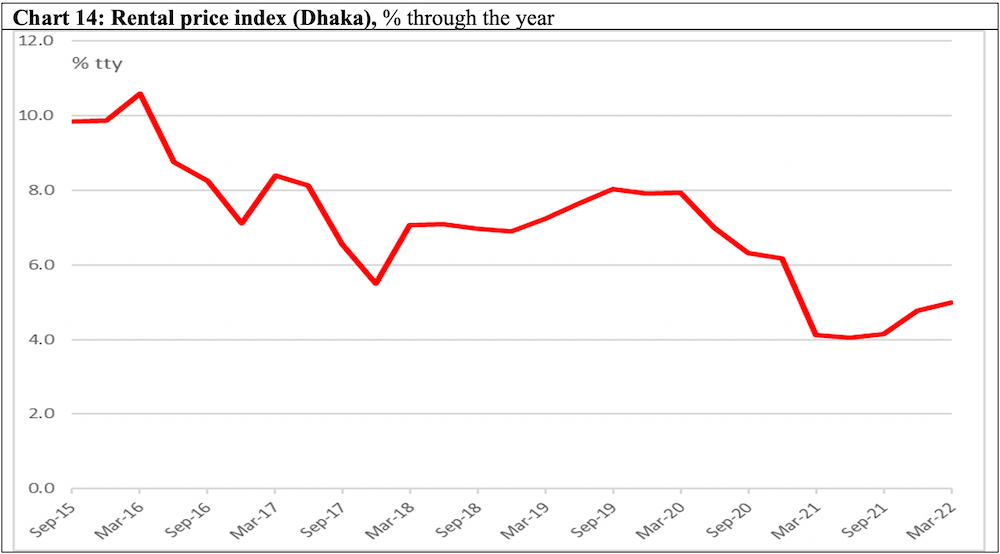
Chart 15, 16, 17: Interest rates, credit to public sector and foreign reserves
Bangladesh Bank cut official interest rates during the pandemic, and both deposit and borrowing rates tumbled. While the central bank has announced that stemming inflation is now the top priority, this is yet to be visible in the interest rates. Public sector borrowing grew at a much faster pace in in 2020-21 compared with the pre‑pandemic years. Although declining, and notwithstanding controversies around classification, Bangladesh Bank’s stock of reserves (expressed in months of imports) were above what it considered an adequate level (usually said to be three months) in March 2022. More recent data showing the impact of recent foreign exchange turbulence, however, are yet to become available.
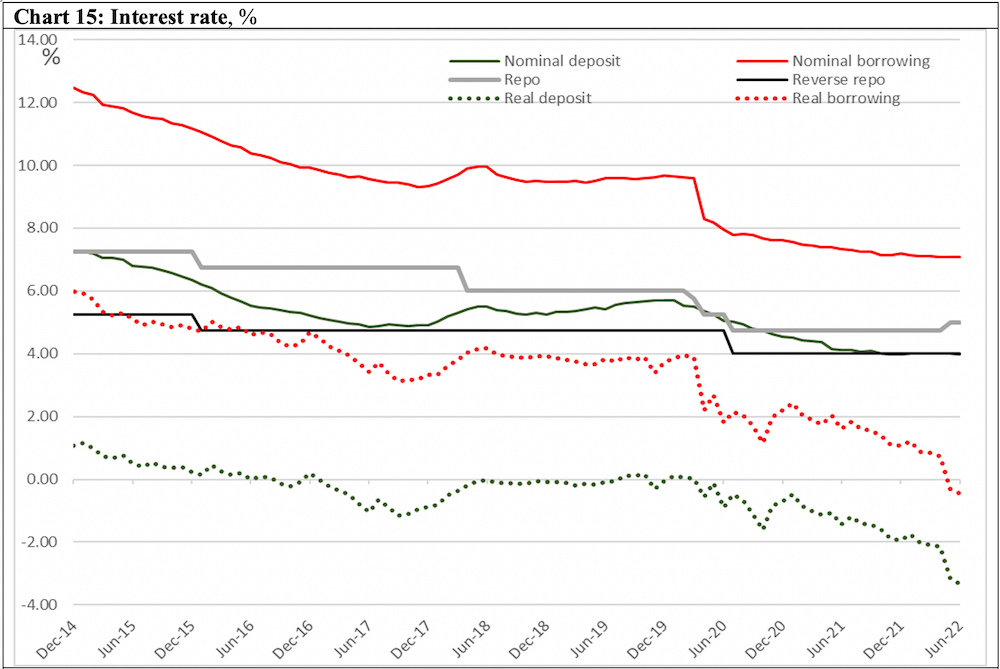
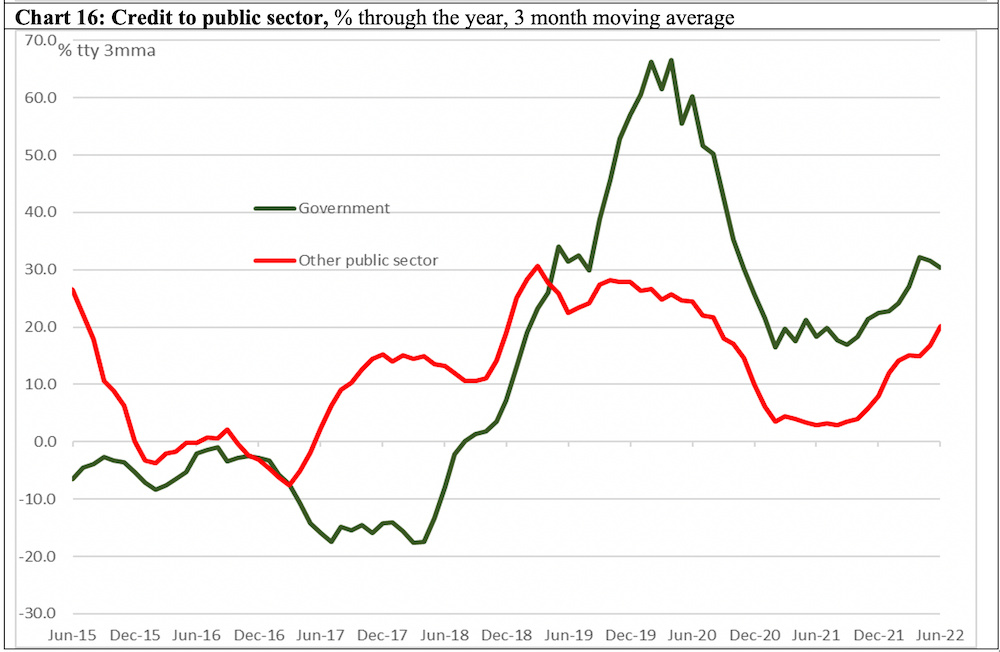

Chart 18: Stock market
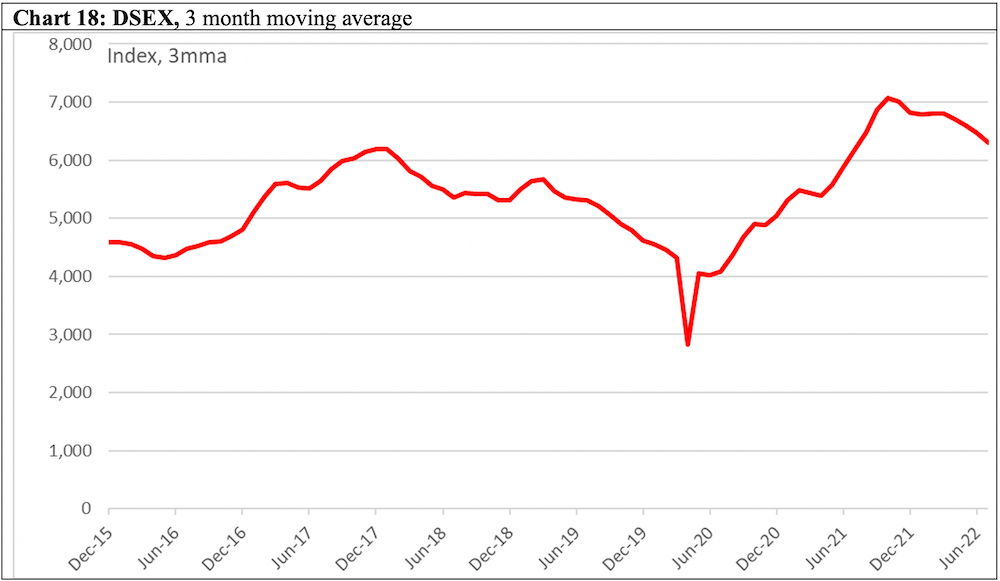
Consistent with many of the indicators above, the Dhaka Stock Exchange (DSEX), has remained generally strong in 2022.
Jyoti Rahman is an applied macroeconomist. His analysis is available at jrahman.substack.com, and he can be contacted at jyoti.rahman at gmail.com.
*All data are from the CEIC Asia Database. Raw data have been smoothed as indicated. The latest available data point in each series is shown in the charts.